

SOS Oil Analysis: What It Measures and How to Read It
SOS analysis detects engine problems months before they fail. We explain what it measures (metals, viscosity, contamination) and how to interpret it.
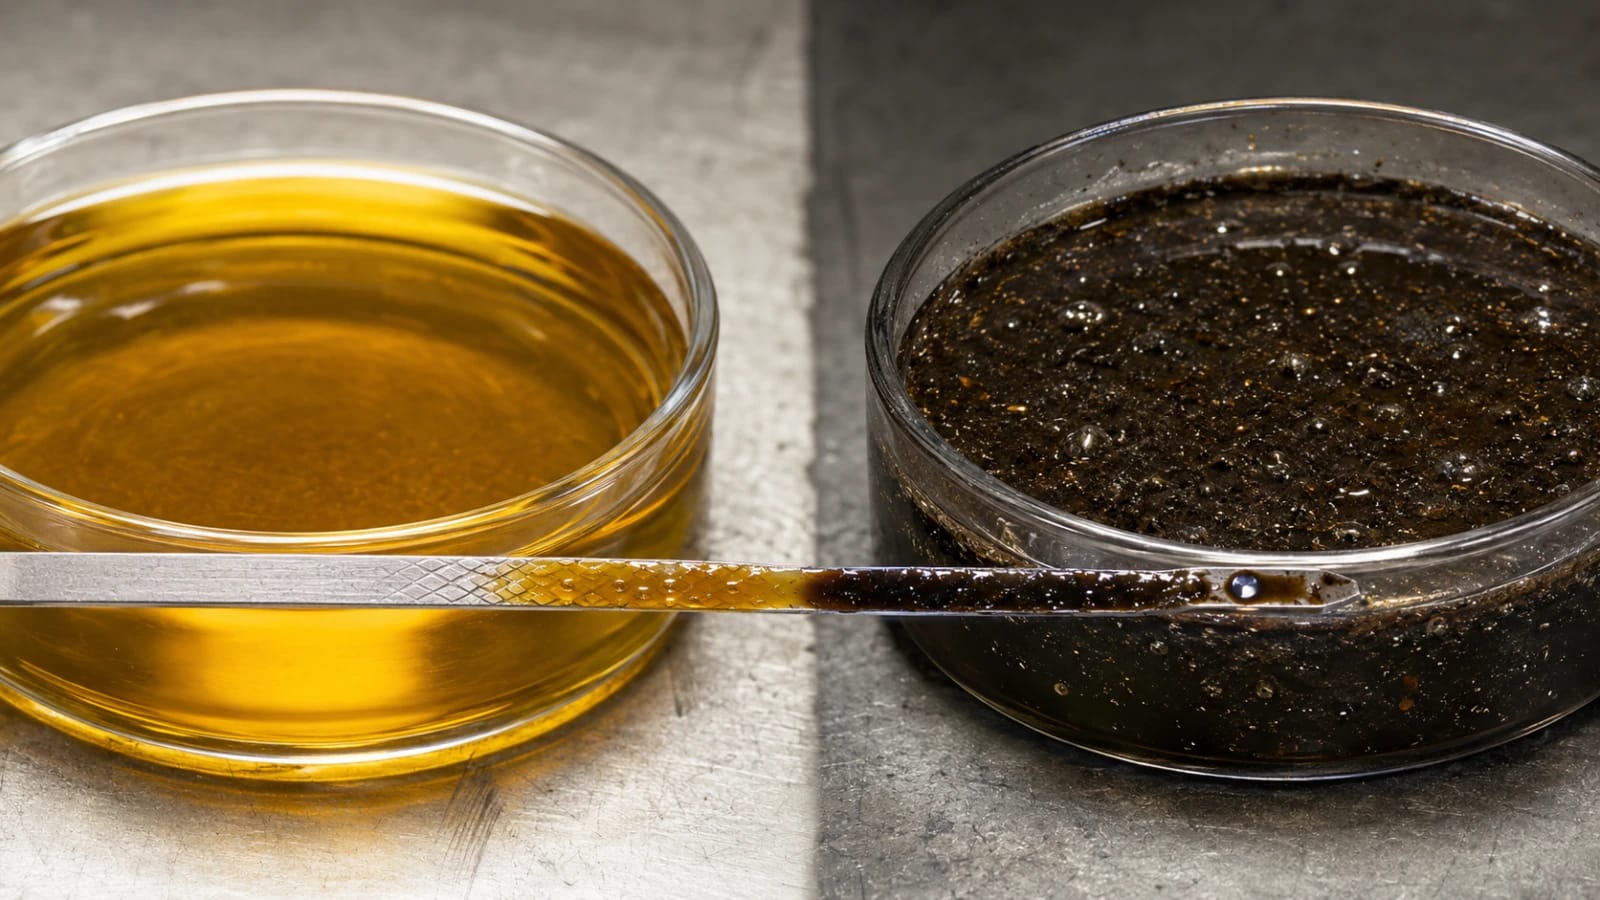
SOS oil analysis (Scheduled Oil Sampling) is one of the most powerful predictive maintenance techniques available. For USD 25-50 per sample, it can detect engine problems months before they cause a catastrophic failure.
This article explains what it measures, how it’s done, and how to interpret the results according to the lubricating oil analysis manual.
What SOS is
SOS = Scheduled Oil Sampling.
It’s a lab service that:
- Chemically and physically analyzes used oil.
- Detects wear metals and contaminants.
- Reports on the condition of the oil and the engine.
- Enables maintenance decisions backed by scientific data.
Caterpillar originally called it S·O·S (Scheduled Oil Sampling) and popularized it in the 1970s. Today Cummins, Volvo, Komatsu, and other manufacturers have their own equivalent programs.
How it’s done
Drawing the sample
Optimal timing: hot oil, engine recently run (contaminants are suspended, not settled at the bottom of the pan).
Amount: 100-150 ml typical. Never less, because the lab needs enough volume for multiple tests.
Cleanest method: draw directly from the dipstick tube using a sampling vacuum pump. The pump creates a vacuum and draws oil up through the dipstick tube, avoiding outside contamination.
Alternative method: draw from the drain plug during an oil change. Less clean, but it works.
Labeling and shipping
Required data:
- Engine ID / serial number.
- Engine hours or mileage.
- Oil hours or mileage (since last change).
- Brand and type of oil used.
- Sampling date.
The lab needs this data to compare against previous samples and similar engines.
At the lab
Multiple tests are run:
- Spectrometry for metals.
- Chromatography for hydrocarbons.
- Karl Fischer for water.
- Titration for TBN and TAN.
- Viscometer for viscosity.
- Visual analysis and particle inspection.
The report is delivered in 5-10 days.
What’s measured
1. Wear metals
Each metal points to wear on a specific component:
| Metal | Indicates wear on: |
|---|---|
| Iron | Liners, crankshaft, camshaft, gears |
| Copper | Connecting rod bearings (copper-lead) |
| Lead | Connecting rod and main bearings |
| Aluminum | Pistons |
| Chromium | Piston rings, resurfaced liners |
| Tin | Coated bearings |
| Silicon | Dust entering through a damaged filter or air intake |
| Sodium | Coolant contamination |
| Potassium | Coolant contamination |
Interpretation:
- Stable values across successive samples = normal wear.
- Gradual increase in a specific metal = a component starting to wear.
- Sudden increase = an active failure.
2. Active additives
Measures how many additives are still active:
- Zinc (Zn): from ZDDP (anti-wear).
- Phosphorus (P): also from ZDDP.
- Calcium (Ca): detergents.
- Magnesium (Mg): detergents.
- Boron (B): alternative anti-wear agent.
Interpretation: decreasing values indicate consumption. Once they drop too low, the oil no longer protects — it needs to be changed.
3. Contaminants
Water: shouldn’t exceed 0.2% (2,000 ppm). Indicates a coolant leak or condensation.
Fuel: shouldn’t exceed 5% (50,000 ppm). Indicates leaking injectors or poor combustion.
Coolant (glycol): any detectable value is a problem. Indicates a blown head gasket or a leaking oil cooler.
Insolubles: microscopic particles that don’t dissolve. A high value means accumulated soot, a compromised filter, or excessive blow-by.
4. Physical properties
Viscosity: compared against nominal viscosity.
- Low = dilution from fuel or solvent.
- High = advanced oxidation or heavy fuel.
TBN (Total Base Number): remaining capacity to neutralize acids.
- New: 8-12.
- At change time: 3-5.
- Below 3: the oil is exhausted, change it NOW.
TAN (Total Acid Number): acidity present.
- New: 0.5-1.5.
- Increases with use.
- Above 3 typically: oxidized oil.
How to read the report
A typical SOS report looks like this (simplified):
METAL / CONTAMINANT     CURRENT   PREVIOUS   STATUS
Iron (ppm)                 120        95      Normal
Copper (ppm)                8         6       Normal
Lead (ppm)                  4         3       Normal
Aluminum (ppm)               3         3       Normal
Silicon (ppm)                5         4       Normal
Water (%)                  0.05      0.04     Normal
Fuel (%)                    2.5       2.3      Normal
Insolubles (%)               0.4       0.3     Normal
Viscosity @100°C (cSt)      14.8      14.5     Normal
TBN                          6.2       7.1      Acceptable
Typical lab status ratings
- Normal: values within the expected range. Continue normal operation.
- Acceptable: values at the upper limit. Increase sampling frequency.
- Caution: values out of range. Investigate the specific cause.
- Critical: values far out of range. Immediate action required.
Practical interpretation examples
Example 1: Rising iron and copper
Report: iron rose from 80 to 200 ppm, copper from 6 to 25 ppm.
Interpretation: connecting rod bearings starting to wear (copper-lead typical). Liners also showing wear (iron).
Action: monitor more frequently, plan an overhaul in the next 50,000-100,000 km.
Example 2: Water present
Report: water 0.8% (very high), sodium 15 ppm (elevated).
Interpretation: coolant entering the oil. A blown head gasket or punctured oil cooler.
Action: stop the engine, pressure-test the cooling system, repair before continuing.
Example 3: Fuel in the oil
Report: fuel 7% (very high), viscosity dropped from 14 to 10 cSt.
Interpretation: leaking injectors or poor combustion. Fuel is diluting the oil.
Action: diagnose injectors with Cummins INSITE or Volvo Tech Tool. Change the oil immediately (diluted oil doesn’t lubricate).
Example 4: High silicon
Report: silicon 25 ppm (very high vs. 5 typical).
Interpretation: dust entering the engine. Damaged air filter or a torn intake hose.
Action: inspect the entire intake system. Change the oil after the repair (the silicon has already contaminated it).
Benefits of regular SOS
In large fleets:
- Real savings of USD 100-500 per vehicle per year (early detection avoids expensive failures).
- Optimized change intervals (safe extended drain).
- Better maintenance scheduling (fewer unplanned stops).
In critical equipment:
- Detection of incipient failures.
- Reduced unplanned downtime.
- Extended service life.
- Documentation for warranty claims.
In older engines:
- Confirm the engine is still viable.
- Identify which component to replace before a full overhaul.
- Justify a “repair vs. replace” decision.
Cost
Cost per sample:
- OEM labs (Cat SOS, Cummins Oil Program): USD 30-50.
- Premium independent labs: USD 25-40.
- Standard labs: USD 15-30.
Return on investment:
Catching a bearing starting to fail in a Cummins ISX engine can avoid:
- A major overhaul from collateral damage: USD 15,000-25,000.
- Additional downtime: USD 2,000-10,000.
A USD 40 analysis can save USD 15,000+. Return on investment: 375x.
Labs and programs
Manufacturer-official:
- Caterpillar S·O·S — the classic, available through Cat dealers.
- Cummins Fleet Sampling — for Cummins fleets.
- Volvo Trucks Oil Analysis — via Volvo dealers.
- Komatsu Oil Sampling — Komatsu’s program.
Recommended independents:
- Blackstone Labs (USA) — widely used by individual consumers.
- WearCheck — present in multiple markets.
- Bureau Veritas — international, premium quality.
- Oil Analyzers Inc (USA).
In summary
SOS oil analysis is the cheapest and most powerful predictive maintenance technique for diesel engines. For USD 25-50 per sample, it catches wear, contamination, and oil condition problems months before they cause failure.
It measures 15-20 key variables: wear metals (iron, copper, lead, aluminum, silicon), contaminants (water, fuel, coolant), active additives (zinc, phosphorus, calcium), and physical properties (viscosity, TBN, TAN).
Recommended frequency: every oil change in commercial fleets, every 500-1,000 hours in critical equipment. For individual operation: at least annually for important engines.
The return on investment is enormous: a USD 40 analysis can avoid USD 15,000+ overhauls. It’s one of the best maintenance investments out there.
Frequently Asked Questions
What exactly is oil SOS? +
What does an SOS analysis measure? +
How often should SOS be done? +
How do I interpret the SOS report? +
Can I get SOS done on my own vehicle? +
Sources
This article was drafted with AI assistance and reviewed by our editorial team before publishing.